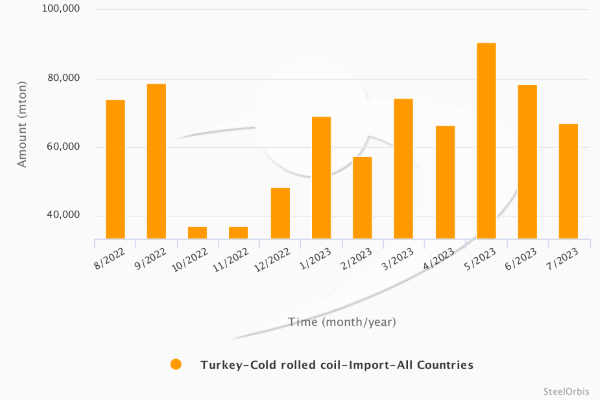
In July this year, Turkey’s cold rolled coil (CRC) imports declined by 14.7 percent month on month and by 30.1 percent year on year to 66,982 mt, according to the data provided by the Turkish Statistical Institute (TUIK). The value of these imports was $59.23 million, decreasing by 14.4 percent compared to the previous month and by 42.3 percent year on year.

Meanwhile, in the January-July period of this year, Turkey’s CRC imports amounted to 503,562 mt, up 22.1 percent year on year, while the revenue generated by these imports totaled $406.83 million, falling by 6.4 percent compared to the same period of 2022.
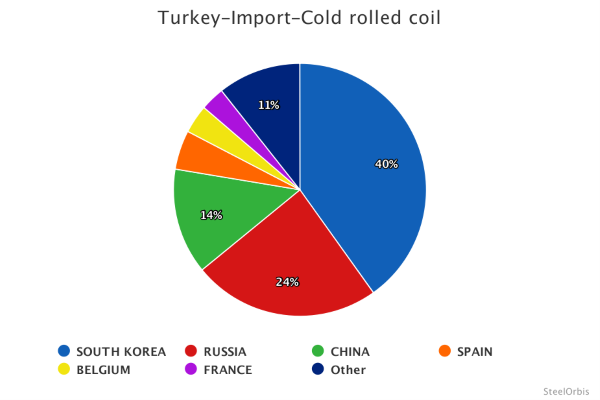
In the first seven months of this year, South Korea ranked first among Turkey’s CRC import sources, supplying 202,078 mt, up 93.6 percent year on year, while South Korea was followed by Russia with 120,626 mt.
Turkey’s main CRC import sources in the January-July period are as follows:
|
Country |
Amount (mt) |
|
|
|
|
|
|
|
January-July 2023 |
January-July 2022 |
Change (%) |
July 2023 |
July 2022 |
Change (%) |
|
South Korea |
202,078 |
104,390 |
+93.6 |
24,858 |
29,527 |
-15.8 |
|
Russia |
120,626 |
145,747 |
-17.2 |
16,834 |
22,925 |
-26.6 |
|
China |
68,185 |
66,764 |
+2.1 |
10,213 |
32,080 |
-68.2 |
|
Spain |
25,190 |
2,088 |
- |
3,527 |
293 |
- |
|
Belgium |
18,395 |
8,970 |
+105.1 |
1,545 |
817 |
+89.1 |
|
France |
15,500 |
3,706 |
+318.2 |
3,913 |
281 |
- |
|
Netherlands |
13,325 |
16,237 |
-17.9 |
2,936 |
1,591 |
+84.5 |
|
Egypt |
8,776 |
1,456 |
+502.7 |
37 |
140 |
-73.6 |
|
India |
7,301 |
20,021 |
-63.5 |
- |
200 |
- |
|
Romania |
6,953 |
11,412 |
-39.1 |
828 |
1,671 |
-50.4 |
Turkey’s CRC import sources in the January-July period can be seen in the graph below:
